

Netdata Self-Hosted, Deploy in One Click
Netdata is a real-time monitoring agent that discovers your stack with zero configuration. Deploying it on your own server gives you full data sovereignty without usage-based fees.
Netdata
AnalyticsNetdata is a real-time performance monitoring tool that provides comprehensive system metrics, application monitoring, and infrastructure health insights.
What you get when you deploy Netdata
The server we rent for it, what it costs, and what the installer will ask you.
- Server
- CX23 · 2 vCPU · 4 GB RAM
- From
- $9/month
- Setup
- No configuration required
Included with every deployment
- Dedicated server, one app per machine
- HTTPS certificate issued automatically
- Free subdomain, custom domain optional
- Restart, resize, snapshot and restore
The project
Everything this page links to outside Automatio.
Deploy Netdata in one click
On your own server, with your own data. No terminal, no Docker commands, no certificate setup.
- 1
Pick a size
Start on the smallest server that fits the app. Resize later without reinstalling.
- 2
Press deploy
We rent the server, install the app with Docker, and point a subdomain at it.
- 3
Watch it come up
Provisioning runs unattended and takes a few minutes. When the HTTPS certificate lands, the app is live and your login details are on the deployment page.
Server size
Billed monthly with your Automatio subscription. Destroy the server any time and the charge stops. Every server: 20 TB traffic/month included, then $2.50 per TB.
Key Capabilities
Explore what Automatio can do for this use case
AI Troubleshooting
Netdata uses unsupervised machine learning to detect anomalies across your stack without manual threshold configuration. The Anomaly Advisor correlates metrics to identify the root cause of incidents, providing evidence-based troubleshooting instead of guessing. It maps the blast radius of failures automatically to show how one component's dip affects others.
- 1Unsupervised ML on every metric
- 2Automated anomaly correlation
- 3Root cause analysis guidance
- 4Blast radius detection maps
- 5Plain English insight reports
Key Capabilities
- AI Troubleshooting
Netdata uses unsupervised machine learning to detect anomalies across your stack without manual threshold configuration. The Anomaly Advisor correlates metrics to identify the root cause of incidents, providing evidence-based troubleshooting instead of guessing. It maps the blast radius of failures automatically to show how one component's dip affects others.
- Unsupervised ML on every metric
- Automated anomaly correlation
- Root cause analysis guidance
- Blast radius detection maps
- Plain English insight reports
- Per-Second Granularity
Unlike legacy tools that sample data every 10 to 60 seconds, this agent collects metrics every single second. This high-fidelity approach captures transient spikes and micro-outages that lower-resolution tools miss. The engine is written in C and typically uses less than 5% of a single CPU core to maintain this resolution.
- 800+ out-of-the-box collectors
- Zero data sampling methodology
- Low 150MB RAM footprint
- Instant dashboard updates
- High-resolution visualizations
- Network Observability
Visualize network topology and analyze live connections directly within the interface. It handles NetFlow, sFlow, and IPFIX traffic while monitoring SNMP devices to provide a unified infrastructure view. The agent maps connections between services without requiring scheduled discovery scans or manual intervention.
- Live network topology viewer
- NetFlow and sFlow analyzer
- SNMP device monitoring support
- Per-port bandwidth tracking
- Automatic node discovery
- Unified Logs and Metrics
Manage system logs and performance metrics in one interface to eliminate context switching. It integrates with systemd journal and Windows event logs, allowing you to filter and search through entries directly alongside performance charts. You can click a performance dip and see the exact logs generated at that second.
- Systemd journal integration
- Windows event log support
- Cross-metric log correlation
- Advanced log search and filtering
- Customizable log dashboards
Why self-host Netdata
What to know first
Managed, DIY, or One-Click?
The three realistic ways to run {name}, compared honestly.
| Aspect | Managed SaaS | DIY on a VPS | Automatio one-click |
|---|---|---|---|
| Data Privacy | Data exported to third-party | 100% private and local | 100% private and local |
| Setup Effort | Low | High (manual Docker/CLI) | One-click deployment |
| Metric Cost | Scales per-GB or per-metric | Fixed VPS cost | Fixed VPS cost |
| Granularity | Often 10s-60s or paid tier | Per-second included | Per-second included |
| Maintenance | Zero | Full OS and app management | Managed infrastructure |
Data Privacy
Setup Effort
Metric Cost
Granularity
Maintenance
Who this is for
People who actually run Netdata on their own server, and what changes when they do.
a platform engineer
Struggling with high cloud monitoring bills that scale with every new metric or container.
You get per-second visibility across every node without worrying about per-metric ingestion charges.
- Deploy centralized parent nodes
- Configure tiered metric retention
- Map real-time network topology
a homelab enthusiast
Wants professional-grade dashboards for local servers without paying a monthly subscription.
Run the full open-source agent for free on your own hardware while keeping all data on-site.
- Monitor NAS disk health
- Track Raspberry Pi temperatures
- Set up local smart home status
a solo SaaS founder
Needs to know why the app is slow without spending hours hunting through disconnected logs.
Correlate performance spikes directly to system logs in a single view for faster debugging.
- Analyze database latency spikes
- Monitor response times per service
- Track synthetic user journey tests
About This App
What this app does and where it fits.
High-Fidelity Infrastructure Observability
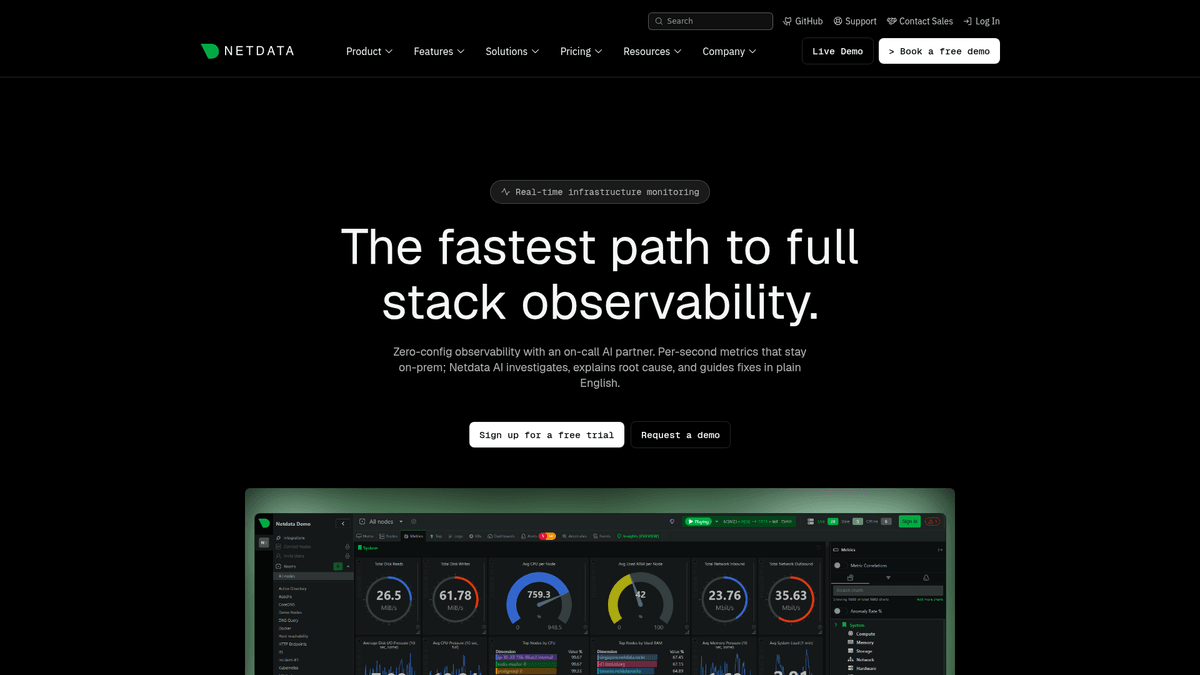
Netdata is a modern monitoring and troubleshooting platform built under the GPLv3+ license. Unlike legacy monitoring tools that rely on polling data at infrequent intervals, it is an edge-native agent designed to collect metrics every single second. This resolution allows you to see exactly what happened during a performance spike or system failure, rather than relying on averaged-out data points that hide the true nature of an incident.
How It Works
The core of the system is the Agent, a highly optimized C-based daemon. It uses an auto-discovery engine that identifies over 800 types of services, applications, and hardware components instantly. Whether you are running NGINX, PostgreSQL, Docker containers, or Kubernetes clusters, the agent identifies the stack and begins populating dashboards immediately. Its distributed architecture means that data processing happens locally on the host, which is why it maintains high granularity with less than 5% CPU usage. This avoids the latency and cost overhead of centralized processing found in tools like Prometheus.
Troubleshooting with AI
One of the standout features is its approach to AIOps. Instead of a simple chatbot, it uses unsupervised machine learning to establish a baseline for every metric. When a metric deviates from its normal pattern, the Anomaly Advisor highlights the shift. During an outage, the platform can correlate these anomalies across hundreds of charts to show the blast radius of a problem and suggest the root cause. This guided troubleshooting transforms how on-call engineers respond to incidents, moving from reactive fire-fighting to evidence-based resolution.
Open Source Maturity
With over 76,000 GitHub stars, the project is one of the most mature monitoring tools in the ecosystem. It is designed to be open-source first, meaning advanced features like machine learning are part of the core agent, not locked behind enterprise paywalls. By self-hosting, you gain access to a tool used by organizations to maintain mission-critical uptime while ensuring that sensitive infrastructure data never leaves your private network. Compared to a Grafana stack, it provides a much lower barriers to entry for real-time visibility.
Community Feedback
See what the community thinks about Netdata
“Out-of-the-Box features! I mostly don't have to develop anything.”
“Netdata gives more than you invest in it. A rare unicorn that obeys the Pareto rule.”
“From 2-3 minutes to 30 seconds, instant visibility into any node issue.”
“The anomaly detection is wild. It caught a failing disk before SMART even tripped.”
“I moved from Datadog to self-hosted Netdata and saved $400 a month in ingestion fees.”
“It can be resource-heavy if you don't tune the storage engine for high node counts.”
Related Videos
Watch tutorials, reviews, and discussions about Netdata
“It gives you that real-time granularity that other systems do not provide by default”
“”
“The auto-discovery is really the standout feature for quick deployment”
“”
“You can see spikes in IO that would be averaged out in Prometheus data points”
“”
“Resource usage for the agent itself is surprisingly low given the data density”
“”
“Netdata Cloud is optional; you can run the agent entirely standalone for privacy”
“”
“Netdata monitors everything on your system out of the box without manual config”
“”
“It collects data every second which provides massive detail compared to others”
“”
“The UI is responsive and updates in real-time as events occur on the server”
“”
“You can drill down into specific containers or processes almost instantly”
“”
“Setting this up takes very little time compared to a standard Grafana stack”
“”
“I use this to keep track of all my virtual machines in one unified view”
“”
“The charts are interactive so you can zoom into specific performance events”
“”
“It is great for identifying which specific disk is causing a latency bottleneck”
“”
“Data retention depends entirely on how much RAM or disk space you allocate”
“”
“The anomaly advisor helps find strange behavior without manual alert setup”
“”
Supercharge your workflow with AI Automation
Automatio combines the power of AI agents, web automation, and smart integrations to help you accomplish more in less time.
What to get right first
The decisions that are painful to change later in Netdata.
Disk Allocation
Allocate at least 3GB of disk space per agent to ensure you can store a year of history at high resolution.
Parent-Child Streaming
When monitoring multiple servers, stream their data to a central Parent node to reduce resource usage on edge devices.
Anomaly Advisor First
During an incident, check the Anomaly Advisor tab first; it correlates metrics to find the source faster than manual browsing.
Notification Integrity
Test your notification channels immediately after setup to ensure that critical alerts are delivered to your mobile device.
Testimonials
What Our Users Say
Join thousands of satisfied users who have transformed their workflow
Jonathan Kogan
Co-Founder/CEO, rpatools.io
Automatio is one of the most used for RPA Tools both internally and externally. It saves us countless hours of work and we realized this could do the same for other startups and so we choose Automatio for most of our automation needs.
Mohammed Ibrahim
CEO, qannas.pro
I have used many tools over the past 5 years, Automatio is the Jack of All trades.. !! it could be your scraping bot in the morning and then it becomes your VA by the noon and in the evening it does your automations.. its amazing!
Ben Bressington
CTO, AiChatSolutions
Automatio is fantastic and simple to use to extract data from any website. This allowed me to replace a developer and do tasks myself as they only take a few minutes to setup and forget about it. Automatio is a game changer!
Sarah Chen
Head of Growth, ScaleUp Labs
We've tried dozens of automation tools, but Automatio stands out for its flexibility and ease of use. Our team productivity increased by 40% within the first month of adoption.
David Park
Founder, DataDriven.io
The AI-powered features in Automatio are incredible. It understands context and adapts to changes in websites automatically. No more broken scrapers!
Emily Rodriguez
Marketing Director, GrowthMetrics
Automatio transformed our lead generation process. What used to take our team days now happens automatically in minutes. The ROI is incredible.
Jonathan Kogan
Co-Founder/CEO, rpatools.io
Automatio is one of the most used for RPA Tools both internally and externally. It saves us countless hours of work and we realized this could do the same for other startups and so we choose Automatio for most of our automation needs.
Mohammed Ibrahim
CEO, qannas.pro
I have used many tools over the past 5 years, Automatio is the Jack of All trades.. !! it could be your scraping bot in the morning and then it becomes your VA by the noon and in the evening it does your automations.. its amazing!
Ben Bressington
CTO, AiChatSolutions
Automatio is fantastic and simple to use to extract data from any website. This allowed me to replace a developer and do tasks myself as they only take a few minutes to setup and forget about it. Automatio is a game changer!
Sarah Chen
Head of Growth, ScaleUp Labs
We've tried dozens of automation tools, but Automatio stands out for its flexibility and ease of use. Our team productivity increased by 40% within the first month of adoption.
David Park
Founder, DataDriven.io
The AI-powered features in Automatio are incredible. It understands context and adapts to changes in websites automatically. No more broken scrapers!
Emily Rodriguez
Marketing Director, GrowthMetrics
Automatio transformed our lead generation process. What used to take our team days now happens automatically in minutes. The ROI is incredible.
Related Self-Hosted Apps

Uptime Kuma
from $9/mo
Uptime Kuma is a free and open source monitoring tool that allows you to monitor your websites and applications.

Umami
from $9/mo
Umami is a simple, fast, privacy-focused alternative to Google Analytics.

Plausible
from $9/mo
Plausible is a open source, self-hosted web analytics platform that lets you track website traffic and user behavior.

Metabase
from $9/mo
Metabase is an open source business intelligence tool that allows you to ask questions and visualize data.

Grafana
from $9/mo
Grafana is an open source platform for data visualization and monitoring.

Formbricks
from $9/mo
Formbricks is an open-source survey and form platform for collecting user data.

ClickHouse
from $9/mo
ClickHouse is an open-source column-oriented DBMS (columnar database management system) for online analytical processing (OLAP) that allows users to generate analytical reports using SQL queries in real-time. ClickHouse works 100-1000x faster than traditional database management systems, and processes hundreds of millions to over a billion rows and tens of gigabytes of data per server per second.
Frequently Asked Questions
Find answers to common questions about Netdata