

Uptime Kuma Self-Hosted, Deploy in One Click
Uptime Kuma is a real-time monitoring tool for websites, services, and APIs. Deploying here gives you a private server, automated HTTPS, and no per-monitor fees.
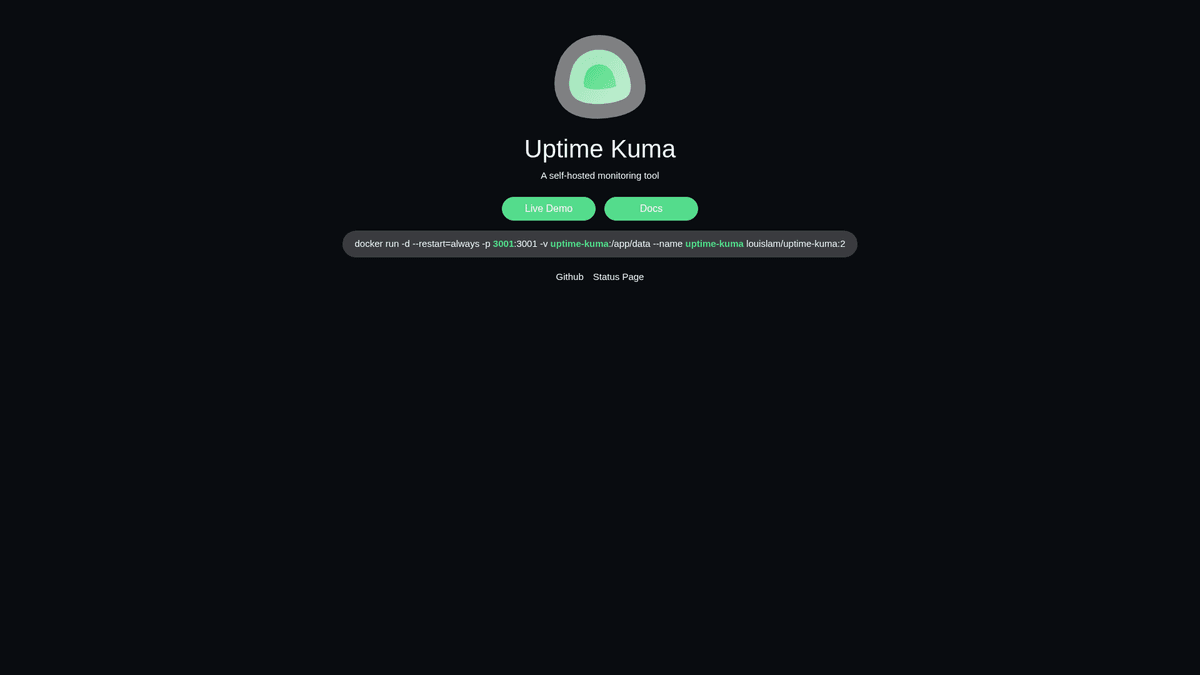
Uptime Kuma
AnalyticsUptime Kuma is a free and open source monitoring tool that allows you to monitor your websites and applications.
What you get when you deploy Uptime Kuma
The server we rent for it, what it costs, and what the installer will ask you.
- Server
- CX23 · 2 vCPU · 4 GB RAM
- From
- $9/month
- Setup
- No configuration required
Included with every deployment
- Dedicated server, one app per machine
- HTTPS certificate issued automatically
- Free subdomain, custom domain optional
- Restart, resize, snapshot and restore
The project
Everything this page links to outside Automatio.
Deploy Uptime Kuma in one click
On your own server, with your own data. No terminal, no Docker commands, no certificate setup.
- 1
Pick a size
Start on the smallest server that fits the app. Resize later without reinstalling.
- 2
Press deploy
We rent the server, install the app with Docker, and point a subdomain at it.
- 3
Watch it come up
Provisioning runs unattended and takes a few minutes. When the HTTPS certificate lands, the app is live and your login details are on the deployment page.
Server size
Billed monthly with your Automatio subscription. Destroy the server any time and the charge stops. Every server: 20 TB traffic/month included, then $2.50 per TB.
Key Capabilities
Explore what Automatio can do for this use case
Multi-protocol monitoring
Verify service health across various networking layers including web, database, and network protocols. You can set specific expected status codes, check for keywords in response bodies, and verify DNS record resolution. This ensures that a site is not just reachable, but also functional.
- 1HTTP and HTTPS tracking
- 2TCP port checking
- 3Ping and ICMP monitoring
- 4DNS record verification
- 5Steam game server support
Key Capabilities
- Multi-protocol monitoring
Verify service health across various networking layers including web, database, and network protocols. You can set specific expected status codes, check for keywords in response bodies, and verify DNS record resolution. This ensures that a site is not just reachable, but also functional.
- HTTP and HTTPS tracking
- TCP port checking
- Ping and ICMP monitoring
- DNS record verification
- Steam game server support
- Notification integration
Connect the monitoring engine to your existing communication tools to get alerts the moment a service fails. The app supports over 90 different notification providers out of the box. You can configure different alert channels for specific groups of monitors based on severity or team.
- Discord and Slack webhooks
- Telegram bot integration
- SMTP and Email alerts
- Pushover and Signal support
- Custom webhook triggers
- Custom status pages
Create public or private pages to communicate service status to your users or internal stakeholders. These pages are decoupled from the main admin dashboard and can be branded with custom logos and CSS. They allow users to check uptime history without needing administrative access.
- Public and private visibility
- Custom CSS styling
- Incident log reporting
- Multi-language support
- Grouped service views
- Reactive dashboard
Monitor your infrastructure through a dashboard built with Vue 3 and Socket.io. The interface updates in real-time as status changes occur, meaning you never have to refresh the page to see current availability. Latency charts show historical response times to help identify performance trends.
- Real-time socket updates
- Historical latency charts
- Dark and light themes
- Responsive mobile UI
- Certificate expiry tracking
- Heartbeat push monitors
Monitor internal servers, cron jobs, or backup scripts that cannot be reached from the public internet. Instead of the dashboard pinging a service, the service sends a "heartbeat" request to a specific URL on the dashboard. If the dashboard doesn't receive this signal within a set window, it triggers an alert.
- Push API endpoint
- Cron job tracking
- Internal server monitoring
- Custom timeout windows
- Success/Failure signal types
Why self-host Uptime Kuma
What to know first
Managed, DIY, or One-Click?
The three realistic ways to run {name}, compared honestly.
| Aspect | Managed SaaS | DIY on a VPS | Automatio one-click |
|---|---|---|---|
| Setup time | Instant | 30-60 minutes | A few minutes |
| Data privacy | Shared with vendor | 100% private | 100% private |
| Cost shape | Per-monitor pricing | Flat VPS fee | Flat VPS fee |
| HTTPS setup | Included | Manual cert management | Automatic Let's Encrypt |
| Status pages | Often limited to 1-2 | Unlimited | Unlimited |
Setup time
Data privacy
Cost shape
HTTPS setup
Status pages
Who this is for
People who actually run Uptime Kuma on their own server, and what changes when they do.
a solo founder
Needs to know if their MVP is down before customers do without paying for enterprise SaaS.
Reliable uptime alerts and historical data for a flat monthly server cost.
- Monitor landing page health
- Set up Slack alerts for API errors
- Track site latency trends
a homelab tinkerer
Managing dozens of local containers and NAS services is difficult to track manually.
A centralized dashboard for all local networking and hardware status.
- Monitor NAS availability
- Track Home Assistant uptime
- Set up push heartbeats for backups
a freelance developer
Clients need proof of uptime but the developer lacks budget for premium monitoring subscriptions.
Professional status pages provided to clients for free as part of the hosting service.
- Build client status pages
- Monitor SSL certificate expiry
- Generate monthly uptime reports
an operations engineer
Proprietary tools cannot reach services behind a corporate firewall.
Monitors internal API endpoints and database ports securely within the local network.
- Monitor internal DB ports
- Track private API latency
- Alert on DNS resolution failures
About This App
What this app does and where it fits.
The open source monitoring standard
Uptime Kuma has become a primary choice for developers who require a private, self-hosted monitoring infrastructure. Created by Louis Lam and released under the MIT license, it was built to solve the reliability and pricing limitations of legacy monitoring tools. By using a modern technology stack, Vue 3 for the interface and Socket.io for backend communication, the application provides a responsive experience where status changes reflect instantly on the dashboard. This architecture avoids the page-refresh delays typical of older monitoring systems.
Monitoring types and architecture
At its core, the application acts as a centralized probing engine. You define monitors by IP address, hostname, or URL. The engine then pings these endpoints at specified intervals. It goes beyond simple connectivity checks; you can configure it to look for specific keyword patterns in the response body or verify that a DNS server is resolving records correctly. For tasks that occur on a schedule, such as database backups or cron jobs, the push monitor type allows the task itself to report in. All historical data, including latency and incident logs, is stored in a local SQLite database, making the entire system self-contained.
Setup and first-hour workflow
After the initial deployment, the workflow centers on dashboard configuration. The first task for most users is establishing an admin account and adding primary website monitors. The application simplifies the alert process by supporting over 90 notification providers. Setting up a Discord webhook or a Telegram bot usually takes less than two minutes. Once the baseline monitors are running, users typically group their services and publish a Status Page. These pages serve as public-facing sites that show uptime percentages and incident history to end-users without giving them access to the management console.
Ownership versus managed services
The main motivation for self-hosting Uptime Kuma is the removal of the "monitor tax." Many proprietary services charge exponentially more as you add more websites or decrease the check interval. With a self-hosted instance, the only limit is the actual CPU and memory of your VPS. Furthermore, for those monitoring sensitive internal applications, hosting your own monitoring server ensures that data about your infrastructure never leaves your controlled environment.
Community Feedback
See what the community thinks about Uptime Kuma
“I previously used UptimeRobot but became abit glitchy and they locked all of the decent features behind expensive paywalls.”
“I started with Uptime Kuma... because our services are not exposed externally, monitoring services cannot monitor them. I run Uptime Kuma on a colocated server and push alerts to it.”
“In this project, I fully used socket.io as the backend and Vue 3 as the frontend... I was looking for a monitoring tool which can watch my internal services... So I decided to build my own one.”
“Uptime Kuma is running on my 8€/mo VPS now! The VPS now runs: Umami, Beszel, and Uptime Kuma.”
“Uptime Robot offers a reliable free website monitoring service that excels in uptime tracking, but Uptime Kuma is my go-to for self-hosting.”
“Uptime Kuma is an amazing monitoring server that can notify you every time your self-hosted app stack goes down.”
Related Videos
Watch tutorials, reviews, and discussions about Uptime Kuma
“This is basically a self-hosted version of UptimeRobot or StatusCake”
“”
“You can monitor HTTP(s), TCP, Ping, DNS records, and even push monitors for things like cron jobs”
“”
“The status pages are really nice because you can show them publicly without giving access to the dashboard”
“”
“It supports tons of notifications like Discord, Telegram, Slack, and even Gotify”
“”
“I love that it has a reactive UI, you do not have to refresh the page to see changes”
“”
“Uptime Kuma is a free, open-source monitoring tool that works similar to commercial services”
“”
“You should not monitor your infrastructure from within the same infrastructure if you want to know if it is really down”
“”
“The setup process is simple since it is just a single Docker container”
“”
“One feature I really like is the ability to monitor SSL certificate expiration dates”
“”
“Adding a new monitor is just a matter of filling out a URL and setting an interval”
“”
“You need to know when your stuff is down before your users or your boss does”
“”
“Uptime Kuma is completely free and it looks amazing, the UI is just functional and responsive”
“”
“You can set up multiple status pages for different groups of services”
“”
“It does not just check if a site is up, it can check if specific text is present on the page”
“”
“The notification system is huge, it integrates with almost everything out there”
“”
Supercharge your workflow with AI Automation
Automatio combines the power of AI agents, web automation, and smart integrations to help you accomplish more in less time.
What to get right first
The decisions that are painful to change later in Uptime Kuma.
Choose the right interval
For non-critical services, use a 60-second interval to minimize CPU usage and prevent your IP from being flagged by aggressive firewalls.
Separate your monitoring
Host the dashboard on a separate server from the websites you are monitoring. If the host server crashes, you need the monitor to stay alive to alert you.
Leverage push monitors
Use the push monitor type for internal tasks like backups or cron jobs that do not have a public URL to ping.
Monitor SSL certificates
The dashboard can track certificate expiration dates automatically, giving you days of notice before a site shows a security warning.
Testimonials
What Our Users Say
Join thousands of satisfied users who have transformed their workflow
Jonathan Kogan
Co-Founder/CEO, rpatools.io
Automatio is one of the most used for RPA Tools both internally and externally. It saves us countless hours of work and we realized this could do the same for other startups and so we choose Automatio for most of our automation needs.
Mohammed Ibrahim
CEO, qannas.pro
I have used many tools over the past 5 years, Automatio is the Jack of All trades.. !! it could be your scraping bot in the morning and then it becomes your VA by the noon and in the evening it does your automations.. its amazing!
Ben Bressington
CTO, AiChatSolutions
Automatio is fantastic and simple to use to extract data from any website. This allowed me to replace a developer and do tasks myself as they only take a few minutes to setup and forget about it. Automatio is a game changer!
Sarah Chen
Head of Growth, ScaleUp Labs
We've tried dozens of automation tools, but Automatio stands out for its flexibility and ease of use. Our team productivity increased by 40% within the first month of adoption.
David Park
Founder, DataDriven.io
The AI-powered features in Automatio are incredible. It understands context and adapts to changes in websites automatically. No more broken scrapers!
Emily Rodriguez
Marketing Director, GrowthMetrics
Automatio transformed our lead generation process. What used to take our team days now happens automatically in minutes. The ROI is incredible.
Jonathan Kogan
Co-Founder/CEO, rpatools.io
Automatio is one of the most used for RPA Tools both internally and externally. It saves us countless hours of work and we realized this could do the same for other startups and so we choose Automatio for most of our automation needs.
Mohammed Ibrahim
CEO, qannas.pro
I have used many tools over the past 5 years, Automatio is the Jack of All trades.. !! it could be your scraping bot in the morning and then it becomes your VA by the noon and in the evening it does your automations.. its amazing!
Ben Bressington
CTO, AiChatSolutions
Automatio is fantastic and simple to use to extract data from any website. This allowed me to replace a developer and do tasks myself as they only take a few minutes to setup and forget about it. Automatio is a game changer!
Sarah Chen
Head of Growth, ScaleUp Labs
We've tried dozens of automation tools, but Automatio stands out for its flexibility and ease of use. Our team productivity increased by 40% within the first month of adoption.
David Park
Founder, DataDriven.io
The AI-powered features in Automatio are incredible. It understands context and adapts to changes in websites automatically. No more broken scrapers!
Emily Rodriguez
Marketing Director, GrowthMetrics
Automatio transformed our lead generation process. What used to take our team days now happens automatically in minutes. The ROI is incredible.
Related Self-Hosted Apps

Umami
from $9/mo
Umami is a simple, fast, privacy-focused alternative to Google Analytics.

Plausible
from $9/mo
Plausible is a open source, self-hosted web analytics platform that lets you track website traffic and user behavior.

Netdata
from $9/mo
Netdata is a real-time performance monitoring tool that provides comprehensive system metrics, application monitoring, and infrastructure health insights.

Metabase
from $9/mo
Metabase is an open source business intelligence tool that allows you to ask questions and visualize data.

Grafana
from $9/mo
Grafana is an open source platform for data visualization and monitoring.

Formbricks
from $9/mo
Formbricks is an open-source survey and form platform for collecting user data.

ClickHouse
from $9/mo
ClickHouse is an open-source column-oriented DBMS (columnar database management system) for online analytical processing (OLAP) that allows users to generate analytical reports using SQL queries in real-time. ClickHouse works 100-1000x faster than traditional database management systems, and processes hundreds of millions to over a billion rows and tens of gigabytes of data per server per second.
Frequently Asked Questions
Find answers to common questions about Uptime Kuma