

Seismic Command Center, Free Earthquake Monitor Template
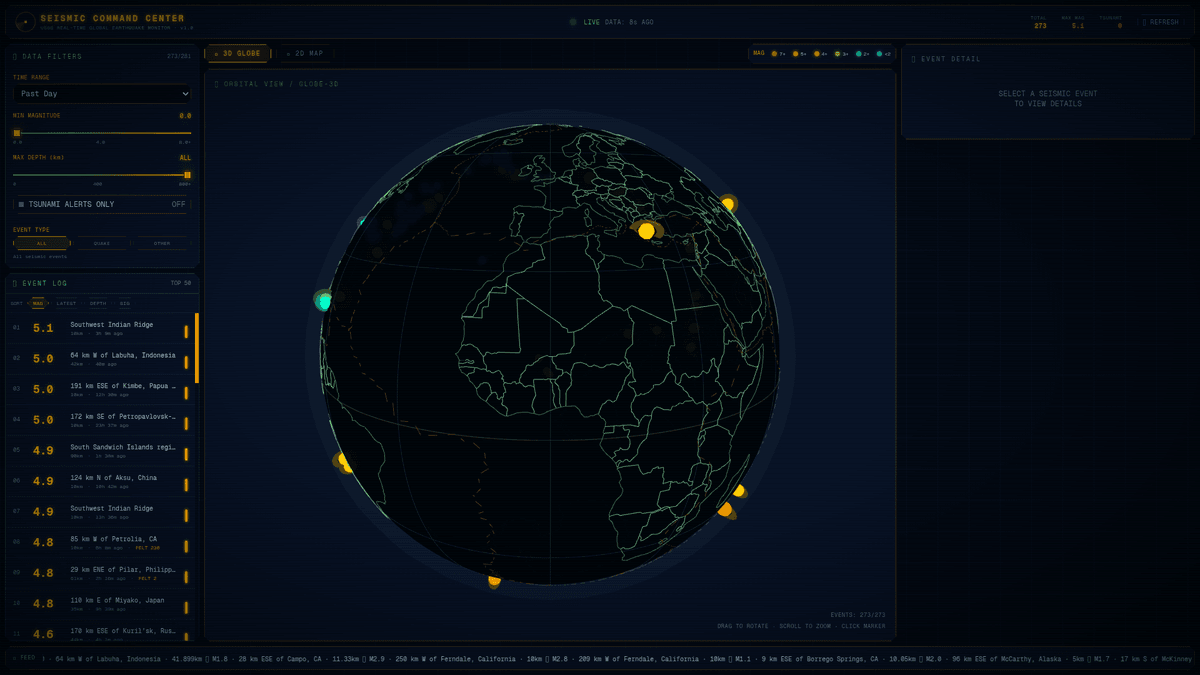
Features an interactive 3D globe, live USGS event logs, and magnitude filters. Clone the source code to your workspace to customize the map and monitoring alerts via chat.
What's inside Seismic Command Center
The parts this template already ships, and what each one is for.
Interactive 3D globe
A rotating orbital view plots global seismic events onto a three-dimensional sphere. You can zoom into specific coordinates to see the exact clustering of recent tremors.
- 13D orbital view
- 2Coordinate-specific plotting
- 3Zoom and rotate controls
- 4Visual magnitude scaling
What's inside Seismic Command Center
- Interactive 3D globe
A rotating orbital view plots global seismic events onto a three-dimensional sphere. You can zoom into specific coordinates to see the exact clustering of recent tremors.
- 3D orbital view
- Coordinate-specific plotting
- Zoom and rotate controls
- Visual magnitude scaling
- Dynamic event filters
A control panel for narrowing the live data by magnitude, depth, and event type. You can toggle tsunami alerts or exclude non-quake seismic activity with one click.
- Magnitude and depth sliders
- Tsunami alert toggle
- Event type selection
- Live count matching
- Live activity log
A sortable ledger of the 50 most recent global events showing magnitude, location, and time. It includes specific felt reports and depth data for high-impact quakes.
- Top 50 recent events
- USGS felt report counts
- Magnitude and depth sorting
- Timestamped event details
Make it yours
The first things people change. Say any of these in the chat and it gets done.
Filter by region
Set the default filter to show only seismic events within 500 miles of the California coastline.
Add visual alerts
Add a visual alert that makes the screen border flash red whenever a quake over magnitude 7.0 is detected.
Daily email summary
Connect the event log to a service that sends a summary of daily seismic activity to my inbox at midnight.
Custom data source
Swap the default USGS feed for the European-Mediterranean Seismological Centre API to get better coverage of tremors in Europe.
About this template
What it is for, and who should skip it.
What you would actually use this for
You keep this open on a second monitor as a situation room dashboard to track regional activity during an active seismic sequence. It is a reliable tool for a geology classroom to demonstrate global tectonic patterns or a base for building a private risk-monitoring app for a logistics company. You would use it to monitor specific fault lines near your infrastructure or to provide a live public information page for a local community. The dashboard provides a view of global activity as it happens, which is helpful for teams that need to coordinate responses to major events in areas like Somalia, Indonesia, or Japan.
What you would change first
Most users will want to narrow the data to their specific region. Ask the chat to set a geographical boundary so the map and log only show events within a few hundred miles of your location. You should also ask the chat to wire the felt reports to a notification system if you need to know when residents are reporting shaking in real time.
When to skip it
This template is a monitoring tool for events that have already occurred, not an early warning system that predicts shaking before it arrives. If you require sub-second latency for emergency shutdowns or automated life-safety alerts, the public data feeds used here will not meet your requirements. It is also not a historical research tool for deep-time seismic data. Skip this if you need professional-grade seismic analysis software with sub-surface modeling features.
Supercharge your workflow with AI Automation
Automatio combines the power of AI agents, web automation, and smart integrations to help you accomplish more in less time.
Related Template Gallery
Skeuomorphic control panel, hardware dashboard template
A skeuomorphic hardware control panel with thermal monitors and tactile toggles. Clone it to your workspace to customize components by chatting with t...
LowWorld 3D Territory World Map Template
LowWorld is a 3D interactive globe where users buy dots to claim territory. Clone it to your workspace to customize the map and pricing via chat instr...
APOGEE Stratospheric Scrollytelling Template
Clone the APOGEE scrollytelling template to build an immersive landing page. It features vertical ascent animations and a lead capture form you edit b...
Black Hole 404, Three.js Interactive Error Page Template
A Three.js 404 page featuring a WebGL2 black hole with real-time physics metrics. Clone it to your workspace to customize the cosmic visuals by chatti...
Fluxora, Cinematic Scroll SaaS Landing Page Template
Build a high-end SaaS site with cinematic GSAP animations and editorial type. Clone this template to your workspace and edit the motion by chatting.
TerraUnits Recreated, 3D Globe Bidding Template
Claim territory on a 3D interactive globe and display your brand link in this TerraUnits Recreated template. Clone it to your workspace and edit via c...
Black Hole 404, Three.js Error Page Template
An interactive Three.js black hole 404 error page. Clone this template into your workspace to customize the cosmic visuals and links using the AI chat...
3D 8-Ball Pool, Game Landing Page Template
Launch your brand with this 3D 8-ball pool template. It features an atmospheric club design that you can clone and edit by chatting in your workspace.
Before you clone
The practical questions, answered.